
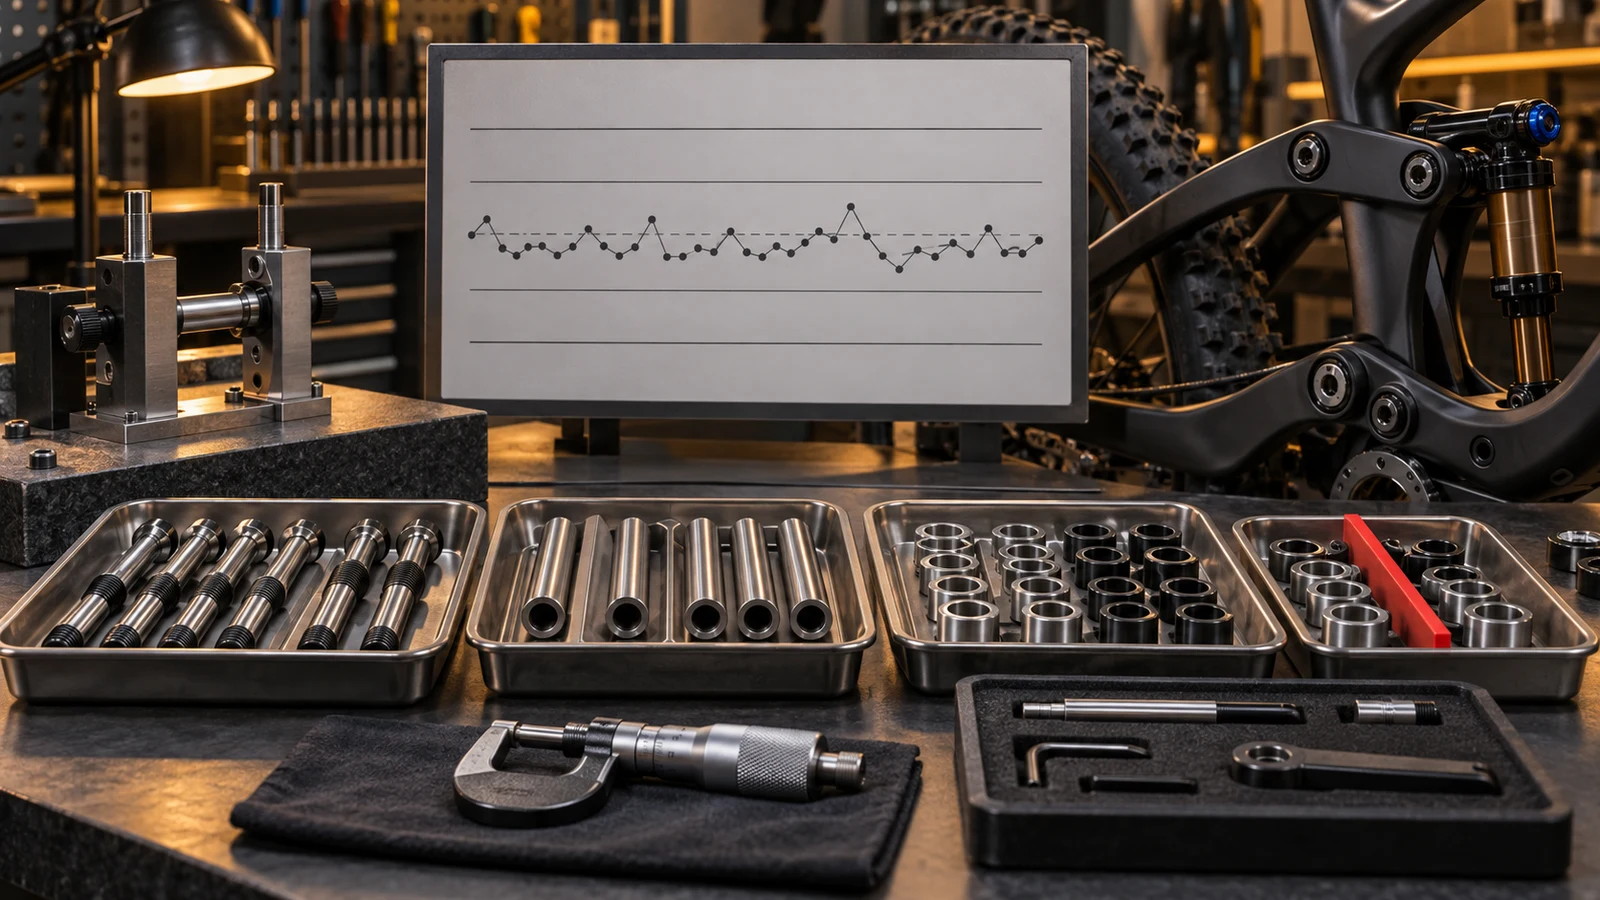
For a bicycle pivot bolt or bearing sleeve, a supplier SPC audit should connect one specified feature to a defined production stream, a suitable measurement method and an actionable response to unusual behavior. Start with that connection, not a displayed Cpk number. The buyer is deciding whether process-control evidence is relevant to the proposed part and whether the supplier can recognize and manage a developing problem. Control limits describe process behavior; drawing limits define the product requirement. Neither a tidy chart nor an isolated capability value proves that every delivered pivot interface conforms, especially when the data mix different setups or omit later finishing.
Hero: concept illustration of example hardware and its application. It is not a factory photograph, tested component or approved production geometry.
Follow one functional feature through the process
Choose a feature whose variation matters to the assembly: a finished bearing-seat diameter, shoulder length or spacer face relationship. State the drawing revision, feature definition, supplied condition and operation being monitored. A shoulder measurement before coating cannot silently represent the final finished interface.
For an audit, ask the supplier to explain how the plotted observations connect to parts and manufacturing events. Look for the relevant setup, tool change, material population and treatment condition. A worksheet named after the whole kit can conceal separate bolt and sleeve processes with different causes of variation.
Use the CNC turning discussion to identify machining questions and the surface-treatment route for later interface changes. This is a feature-specific process review, distinct from the PPAP submission-scope decision.
Keep control limits separate from drawing limits
The NIST control-chart overview describes observations plotted in sequence with a center line and control limits. It also explains why nonrandom behavior can require investigation even when individual points remain inside those limits. The chart and its interpretation rules must therefore be identified, not inferred from its appearance.
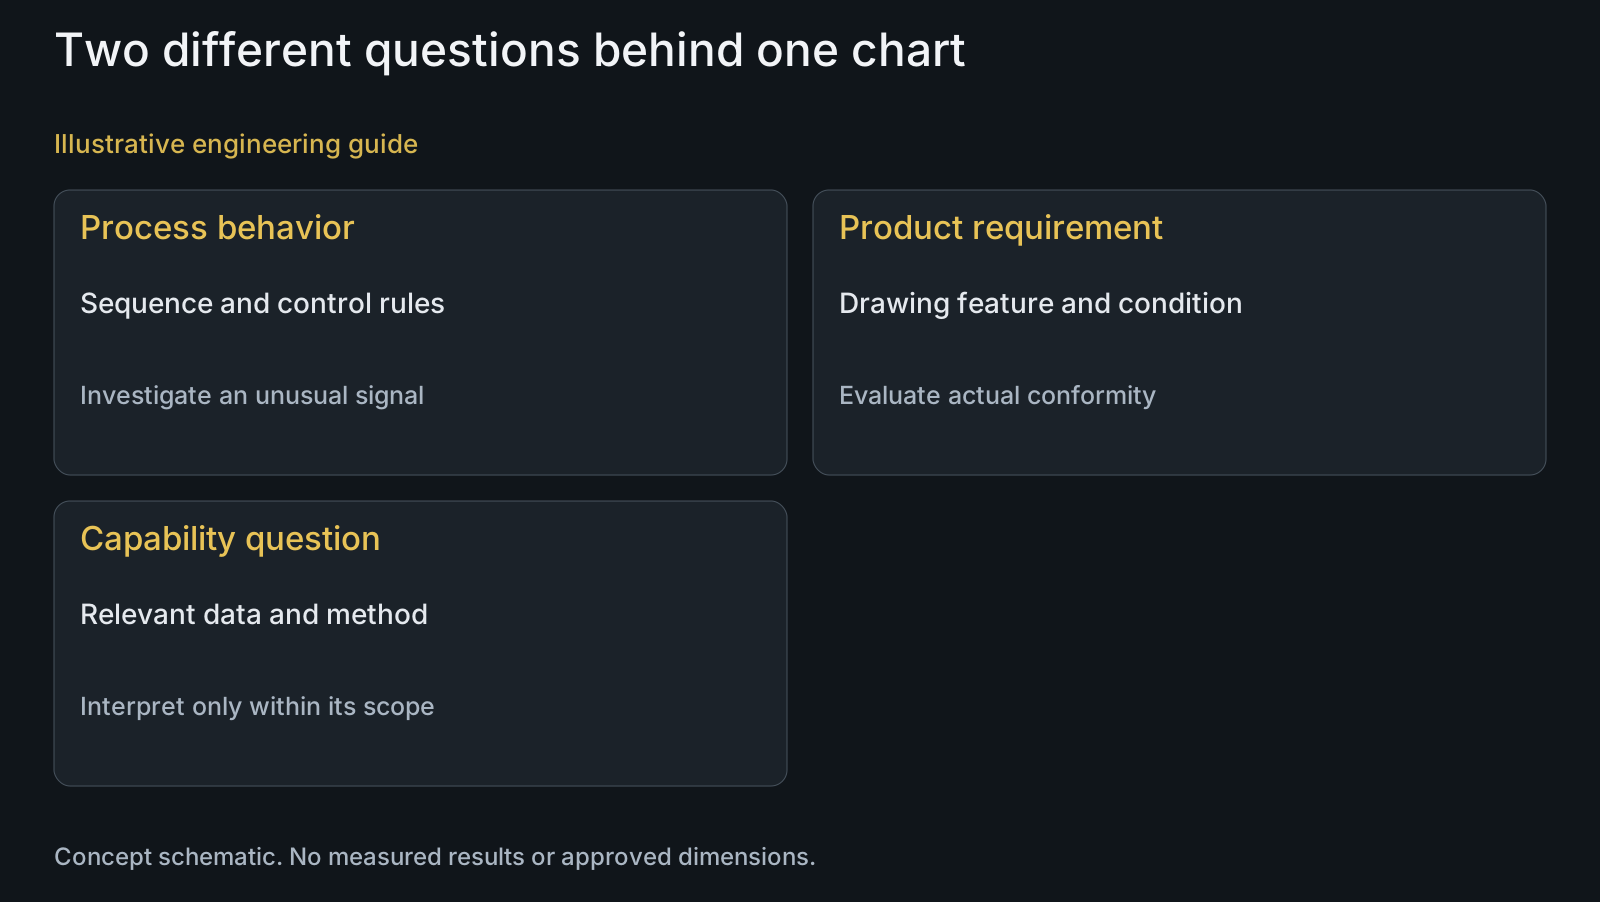
Drawing limits serve a different purpose: deciding whether the specified characteristic meets the product requirement. A process signal can arise while sampled parts still meet drawing limits. Conversely, a repeatable process can keep producing the wrong size. Ask separately what happened to the process and what is known about product conformity.
Do not demand that a supplier replace statistically established control limits with tolerance lines to make the chart look acceptable. Displaying drawing boundaries can aid discussion, but the labels must distinguish them. A reviewer should be able to name which boundary triggered investigation and which requirement governs disposition.
| Evidence presented | Buyer question | Misreading risk | Focused verification |
|---|---|---|---|
| Feature chart | Which delivered interface does it represent? | Pre-finish size treated as finished fit | Match revision, operation and condition |
| Sampling sequence | Are observations from a coherent stream? | Unlike setups pooled into one picture | Review order and relevant process events |
| Measurement method | Can a method change explain the signal? | Gauging variation blamed on tooling | Compare support, contact and method records |
| Capability estimate | What requirement and data basis apply? | Factory-wide rating inferred from one feature | Check limits, stability and agreed analysis |
| Abnormal-event response | Which parts were evaluated? | Adjustment mistaken for product disposition | Follow population and downstream location |
| Restart evidence | What resolved the suspected cause? | New chart hides unresolved behavior | Review justification and subsequent control |
Check what the observations actually represent
Preserve observation order and explain the sampling arrangement. If a report merges different machines, cavity positions, drawing revisions or setup conditions, ask why combining them is meaningful. An average across unlike streams can hide the particular operation the buyer needs to understand.
Identify how the feature was measured: contact location, datum or support, resolution, relevant measurement-system evidence and part condition. For a thin sleeve, a change in holding or contact force may change the reading. Investigating that possibility is different from immediately compensating the cutting tool.
The measurement-capability review addresses task suitability. Here the additional question is whether that method remained consistent across the plotted sequence. Retain observations and method changes so a later investigation does not mistake a measurement change for a machining change.
Use Cpk only within an agreed capability question
The NIST process-capability chapter evaluates a stable process against specification limits and identifies assumptions behind conventional indices, including distribution and data sufficiency. A reported estimate needs its characteristic, limits, data basis and calculation method. It is not a transferable rating for the entire factory.
Cpk of 1.33 may be a proposed project acceptance threshold, but it is not adopted here as a universal bicycle requirement or a PremFixer result. Agree the customer's requirement and statistical method before using a number to accept a process. An unsuitable distribution or an unstable stream requires a reasoned analysis, not a conveniently chosen formula.
Ask what was excluded from the study and why. Data from a settled repeat run may answer a different question from data including every setup or finishing return. Keep that scope visible when estimating whether the evidence represents the production condition being purchased.
Trace one unusual signal to containment and restart
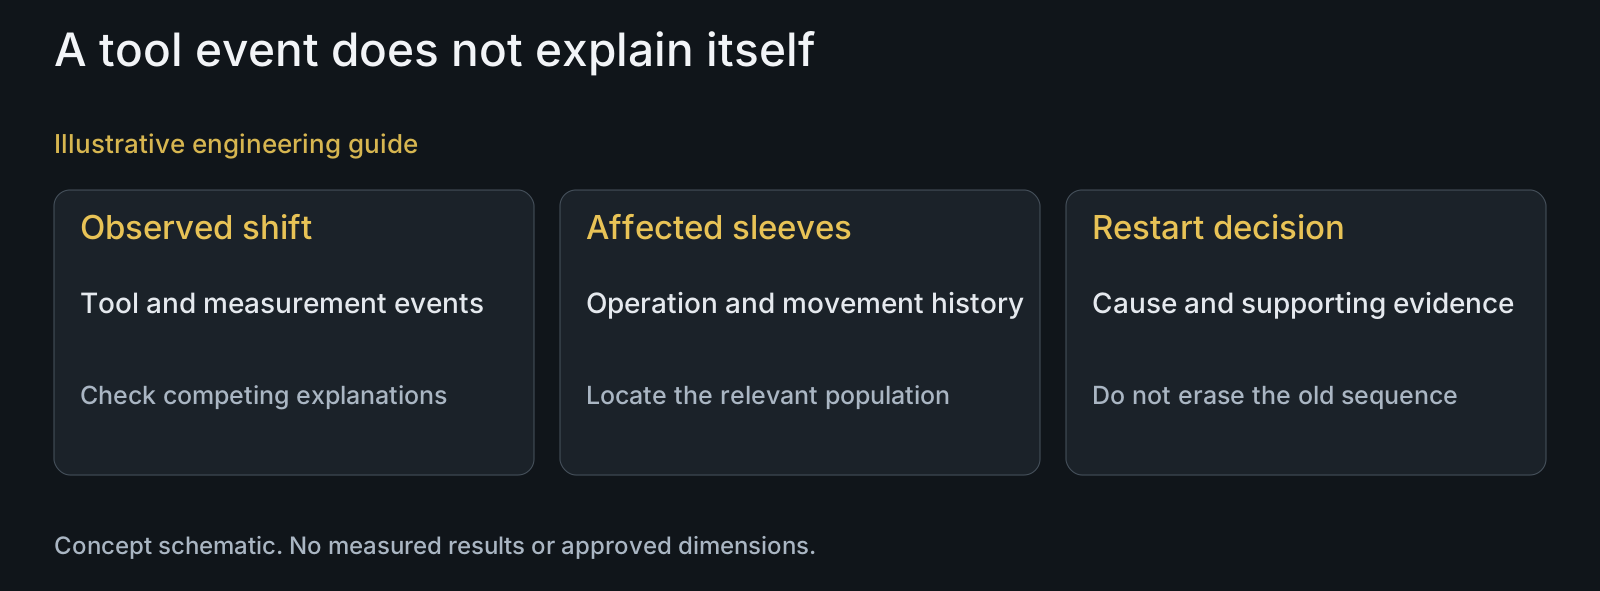
Request a permitted, relevant example of a signal and the associated decisions. The response should distinguish checking the measurement, investigating the process and deciding which parts require evaluation. A note saying tool adjusted does not explain the potentially affected population.
Review how the supplier located material produced since the last meaningful check and handled work already moved to another operation or packing area. Segregation should refer to identifiable parts rather than an unspecified batch. Shipment status matters because the response may need coordination beyond the machine.
For restart, ask what evidence addressed the suspected cause and what justified resumed manufacture under the agreed control plan. Re-centering the chart or deleting inconvenient points is not an explanation. Broader corrective action should connect to the identified cause and recurrence risk; it need not be invented when no real event record is available.
Illustrative review: a sleeve chart after a tool change
Illustrative engineering example: assume an OEM is reviewing a bearing sleeve's outside diameter. The proposed record shows a sequence shift near a tool replacement, while the measured samples remain within the stated drawing limits. No actual measurements, chart calculation, customer event or approval outcome is supplied.
The reviewer first asks whether the tool event, measurement setup and observation sequence align. If the measuring support also changed, the apparent shift cannot yet be attributed solely to machining. The supplier should explain the competing causes and identify the sleeve population requiring evaluation, including pieces already sent for finishing.
The useful decision is whether the evidence resolves process behavior and product status separately. Conforming samples do not erase the signal, and a signal alone does not prove every sleeve defective. For a new project, agree the feature-specific evidence with PremFixer rather than assuming this example documents an existing SPC program for every part family.
Questions buyers need to confirm
What should an OEM look for in a pivot supplier's SPC records?
Look for a specified feature, coherent observation sequence, consistent measurement method and an explained response to signals. Ask which parts and production condition the evidence represents. A chart from another part or operation cannot qualify the proposed pivot interface by resemblance.
Are control limits the same as drawing tolerances?
No. Control limits concern process behavior; drawing limits define the product requirement. Ask which boundary triggered investigation and how actual parts were evaluated. Do not treat a process signal as automatic proof of rejection or a stable chart as automatic proof of conformity.
Must every bicycle pivot feature achieve Cpk of 1.33?
No universal requirement is established here. A customer may specify that threshold for an identified feature and agreed analysis. Confirm the applicable limits, production condition, data basis and statistical assumptions. This article reports no PremFixer capability value.
Can measurements from several machines be combined?
Only with a justified analysis for the intended question. Identify the machines, setups, revisions and observation sequence first. If their behavior differs, a pooled result may obscure the stream that needs action. Request separate examination rather than choosing the most favorable combined value.
Does an abnormal signal require scrapping the whole batch?
Not automatically. Investigate the signal and determine the affected population and applicable product evidence. Trace parts through later operations and shipment status. Disposition must follow the agreed requirements and authority, not a chart annotation alone.
What should a buyer send for an SPC discussion with PremFixer?
Send the drawing revision, functional features, supplied finish, expected production route and customer control or capability requirements. Include permitted example data and measurement information if available. Confirm feature-specific evidence, responsibilities and feasibility rather than assuming a ready-made study for every part.
Technical references and scope
NIST/SEMATECH, What are Control Charts?. Public engineering explanation of sequence-based charts and investigation of unusual or nonrandom behavior; not a customer-specific reaction plan.
NIST/SEMATECH, What is Process Capability?. Public statistical discussion of stable-process capability and conventional index assumptions; no universal bicycle acceptance threshold adopted.
Explore related component, material and sourcing decisions in the customer decision knowledge center. For a drawing review, use the Drawing/BOM RFQ path.
Define the feature-specific process-control review
Share the drawing or STEP model, identified pivot interfaces, supplied-state requirements, production volumes and customer SPC criteria through the Drawing/BOM RFQ path. PremFixer can discuss which operations and evidence need project confirmation; the request does not presume an existing capability result or automatic process approval.
Discuss the drawing and BOM