
Analyze pivot-hardware spend by first identifying what each transaction represents: a component or kit, its revision, supplied condition, quantity unit, currency and reporting event. Then separate price movements from volume, product mix and scope changes. More spend does not automatically indicate worse purchasing, and a lower average price does not prove savings if the BOM changed. Use material, supplier and cost-category views to locate specific review questions, not to rank sources from unexplained totals. Keep performance evidence separate from spending concentration. This article describes an analytical approach, not a PremFixer dashboard, customer purchasing record or claimed cost reduction.
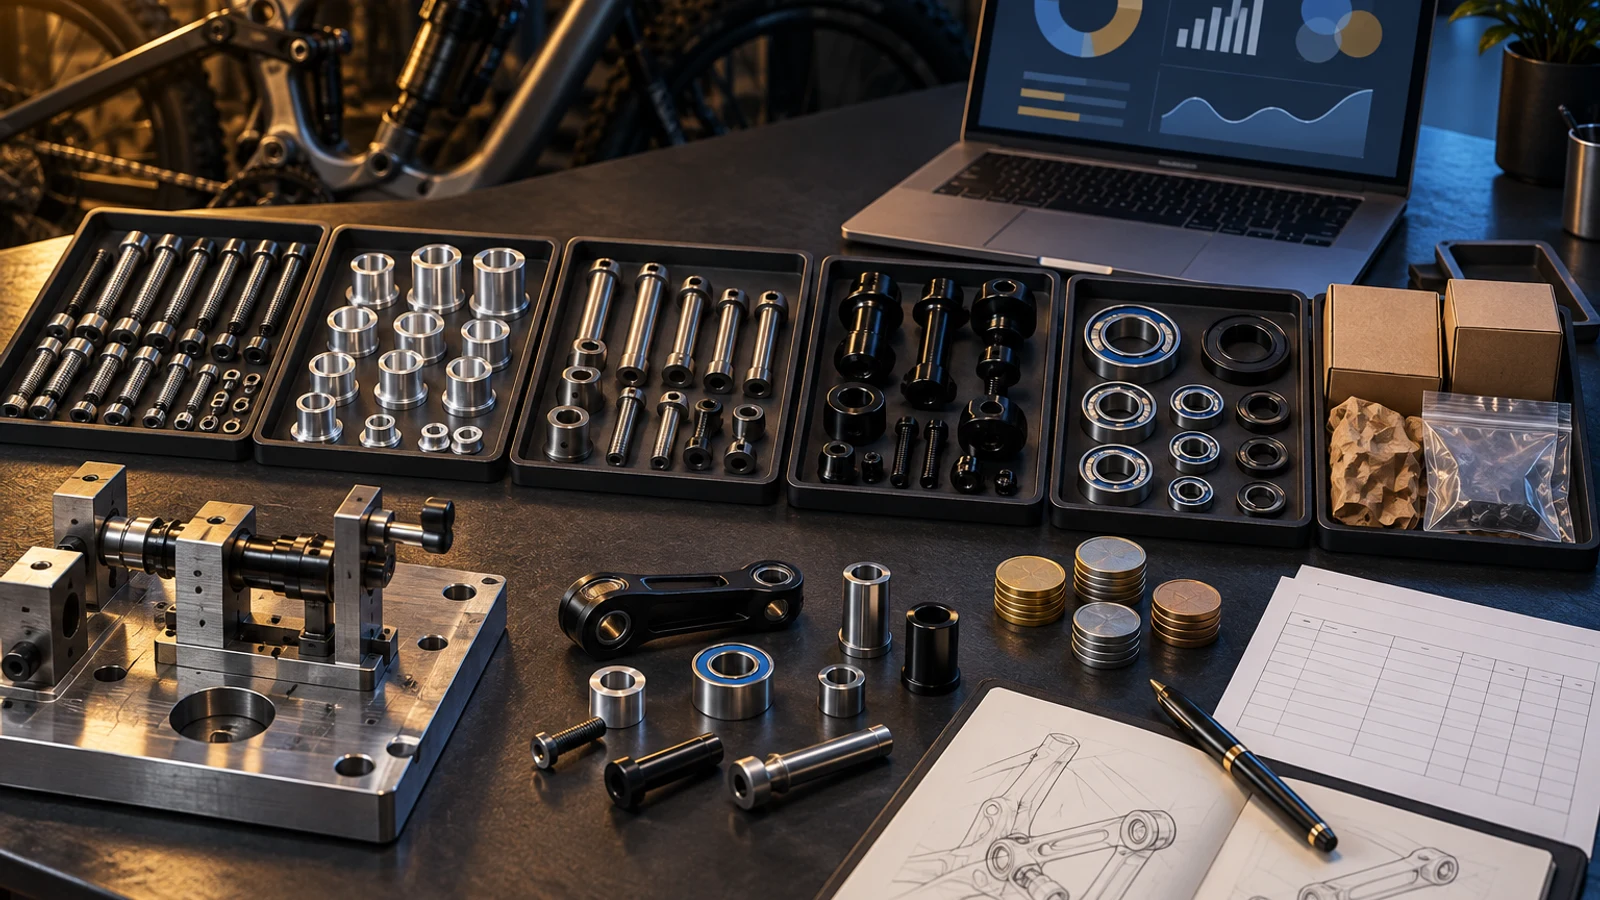
Hero: concept illustration of example hardware and its application. It is not a factory photograph, tested component or approved production geometry.
Choose one transaction basis for the question
Order values, invoiced amounts and paid amounts represent different events. Decide whether the analysis concerns commitments, received supply or cash movement, then keep that basis visible. Combining all three can count the same purchase more than once.
Identify the period, treatment of corrections and included categories. Freight, preparation and component charges may appear on separate lines or within unit prices. Preserve those differences rather than double-count a separately shown charge after assuming it is already included.
SAP's public procurement-analytics lesson describes reporting from different source records and classification of spend data in its product context. This supports distinguishing inputs before charting them, not a promise of deployed SAP functionality at PremFixer.
Normalize identity without erasing meaningful differences
Map customer and supplier aliases to the intended component, but retain revision and final condition where they change the purchase. Two similar descriptions can be different sleeves, while two different descriptions may refer to the same unchanged drawing. Confirm the relationship rather than merge by text resemblance alone.
Distinguish kits from pieces and identify quantities per accepted BOM. A unit-price comparison must use an equivalent quantity basis. If one period purchases a complete kit and another buys only bolts, their apparent average prices cannot measure an unchanged purchase.
Keep original currency and the stated reporting-conversion basis. Converted spend can change when exchange assumptions change, even if the supplier-currency price remains constant. The currency quotation guide separates reference conversion from a binding alternate offer.
| Observed finding | Possible explanation | Risky inference | Useful review |
|---|---|---|---|
| Total spend increased | More purchased quantity or added work | Purchasing performance deteriorated | Match transaction scope and demand |
| Average price increased | Product mix shifted toward complete kits | Every identical item rose in price | Separate matched items from changed mix |
| Supplier concentration increased | Consolidated scope or different program share | Source risk is already unacceptable | Review dependency and viable alternatives |
| Material category changed | Alias mapping or actual specification change | Material substitution is approved | Check drawing and classification basis |
| Preparation charges recur | Separate lots or changed configuration | All repeated work is waste | Identify the event that required the work |
| Converted spend changed | Exchange basis or original currency price | Supplier repriced the component | Retain original price and conversion basis |
Separate price, volume and mix effects
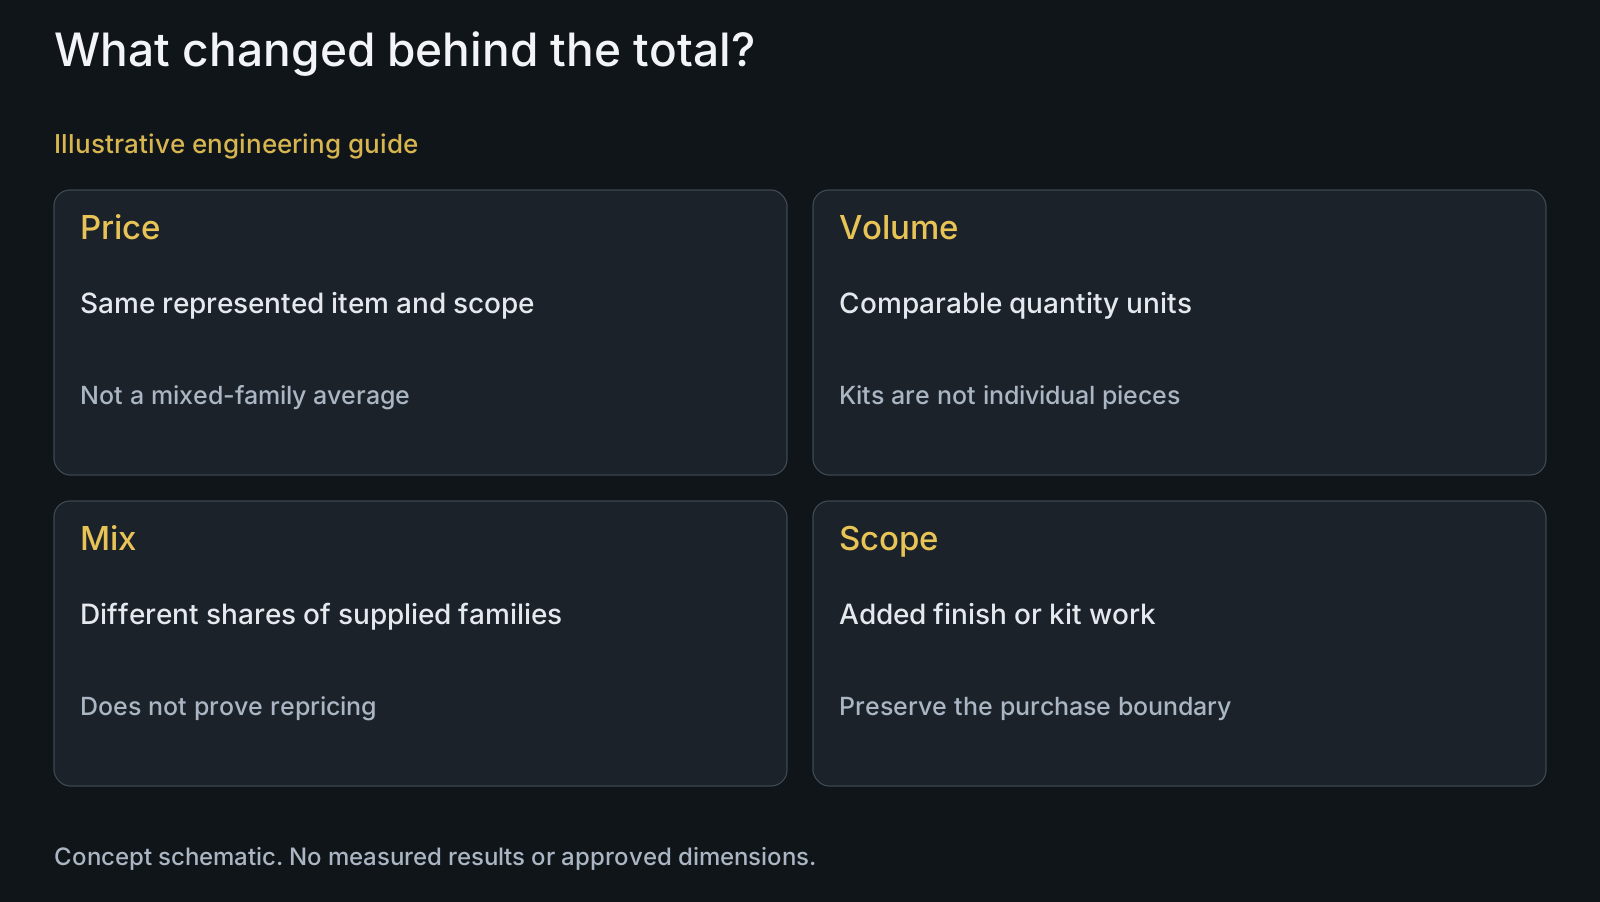
For unchanged comparable items, examine unit-price movement separately from quantity. Then identify additions, removals and changed shares of product families. A higher share of treated or more complex hardware can raise aggregate average price without increasing any matched item's price.
State how scope and revision changes are handled. Do not silently place a new finished condition into the old comparison group. Keep a bridge between the two purchase definitions so engineering can see whether a change concerns geometry, treatment or evidence rather than only supplier pricing.
No unique decomposition is prescribed for every dataset. Show the chosen comparison method, underlying quantities and limitations. The annual cost-improvement article examines initiative attribution; this analysis first asks what the purchasing records can actually support.
Use categories to form a bounded action hypothesis
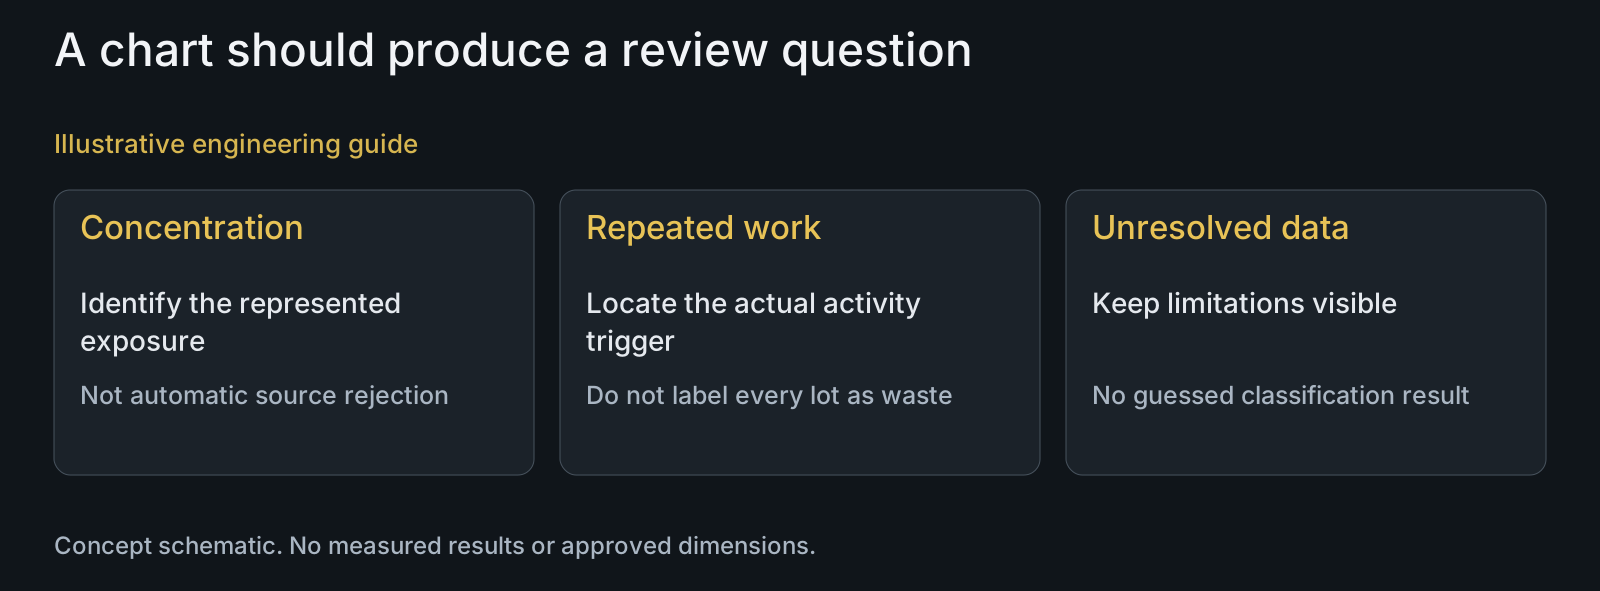
Material and supplier concentration can identify exposure or a possible consolidation discussion. They do not by themselves prove that one material should be replaced or one source is unsuitable. Include function, usable demand and qualification dependencies before proposing an alternative.
Repeated preparation or obsolete-version purchases can prompt a review of release scheduling or revision handling. Confirm their actual represented work and cause before labeling them waste. The manufacturing overview helps connect cost categories to physical operations.
Link spend findings to relevant quality and delivery evidence without treating high spend as poor performance. The supplier KPI guide keeps populations and event definitions explicit. A spend chart and a conformity metric answer different questions.
Review a changing kit mix before alleging a price increase
Illustrative engineering example: assume an OEM buys an unchanged bolt-only scope in one period and more complete treated kits in another. The dashboard shows higher spend and a higher average transaction price. No actual quantities, prices or achieved result is assumed.
The analyst separates the matched bolt scope from newly included sleeves, treatment and packing. It checks quantity units and whether the reports use the same transaction event and currency basis. Only comparable unchanged supply can support a direct unit-price comparison.
The team can then ask whether added kit work or changed demand is justified for the program. The example does not claim savings or favorable performance. It prevents the aggregate chart from falsely identifying an identical-item price increase.
Keep unresolved records visible rather than manufacturing precision
When a line lacks revision, quantity basis or category, preserve the gap and its effect on the analysis. An unclassified amount can remain visible without being assigned a guessed material family. State which conclusions cannot yet be supported.
Ask the record owner to reconcile duplicates, corrections and ambiguous descriptions before dependent decisions. A visually consistent dashboard cannot repair conflicting definitions merely by applying colors and totals. Keep the source relationship available for the reviewer.
Use materials information and the knowledge center to frame a manufacturing question from the finding. PremFixer can discuss comparable component scope; this article offers no external financial audit, data-platform deployment or guaranteed savings service.
Questions buyers need to confirm
Does higher spend mean our supplier increased prices?
Not necessarily. Quantity, product mix, supplied scope and currency conversion can change totals. Compare matched unchanged items on the same transaction and quantity basis before attributing the movement to price.
Can kits and pieces share one average unit price?
Only with an explicitly equivalent conversion and supplied scope. Kit contents can change by revision, and a bolt-only purchase is not automatically equivalent to a complete kit. Keep the original units and BOM relationship visible.
Should aliases be merged automatically?
Do not rely on similar descriptions alone. Confirm part identity, revision and finished condition. Keep meaningful technical differences while reconciling genuine aliases with the responsible record owner.
Can a dashboard correct duplicate invoices?
Not by presentation alone. Reconcile transaction identity, corrections and reporting event. Counting commitments, invoices and payments together can duplicate one purchase unless the relationship is explicitly handled.
Does supplier spend share measure quality performance?
No. It measures the represented spending concentration. Evaluate conformity and delivery with their own relevant populations and events; a large spend share does not establish a high or low defect rate.
What should remain visible when classification is incomplete?
The unresolved amount, missing identity or category and conclusions affected by it. Do not assign a guessed material or revision merely to complete a chart. Seek clarification before dependent sourcing decisions.
Technical references and scope
SAP procurement analytics lesson. Product-context reporting sources and spend-classification description; no current platform deployment or roadmap recommendation for PremFixer.
Explore related component, material and sourcing decisions in the customer decision knowledge center. For a drawing review, use the Drawing/BOM RFQ path.
Turn the spend finding into a comparable manufacturing question
Send the relevant drawings, STEP, BOM revisions, quantities, supplied condition and a non-sensitive summary of the comparison through the Drawing/BOM RFQ path. Identify the suspected scope or activity difference so PremFixer can discuss manufacturing alternatives without claiming a financial audit or guaranteed reduction.
Discuss the drawing and BOM